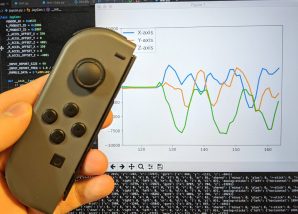
Nintendo SwitchのコントローラJoy-Conに搭載された加速度センサの値を取得し、リアルタイムにグラフ描画するサンプルを作成します。
記事下部に掲載のコードを実行することで、動画のようなサンプルを試すことができます。
Bluetooth対応PCとNintendo Switchさえあれば、手軽に加速度やジャイロセンサの値を取得して(しかもリアルタイムに)活用することができます。
PoCや研究、ちょっとした遊びに活用できそうです。
目次
・PCとのペアリング
・joycon-pythonライブラリを試す
・加速度の描画
Nintendo SwitchのJoy-Conで加速度をリアルタイム描画してみた pic.twitter.com/igSatKRMOv
— mio.yokohama (@mio_yokohama) March 29, 2020
環境
・Python3
・Mac
ライブラリ
・joycon-python
・matplotlib
PCとのペアリング
Bluetoothにはプロファイルと呼ばれる通信手順を定めた仕様の定義が存在します。
Joy-ConはBluetooth HIDプロファイルを使用してPCと接続、通信、操作することができます。
まずは通常のBluetoothアクセサリと同じようにペアリングします。
Joy-Conをペアリングモードにするには、ランプが光るまでシンクロボタンを長く押します。
PCでJoy-Conを選択し接続します。このサンプルではJoy-Con(L)を使用します。
joycon-pythonライブラリを試す
このライブラリはHIDによるコネクションやセンサーのセットアップ、データ変換をラップしているため、これらを意識することなくJoy-Conを使用できます。ライブラリは2020年4月現在開発中のため、githubを参照し最新の情報を確認してください。
下記のコードを実行し、Joy-Conのセンサデータが取得できることを確認します。
from pyjoycon import device
from pyjoycon.joycon import JoyCon

# JoyCon
ids = device.get_ids("L")
joycon = JoyCon(*ids)

while True:
    # JoyCon情報取得
    input_report = joycon.get_status()
    print(input_report)
なお、特定のBluetooth機器が接続されている時に、hid.device()が失敗する場合がありました。
接続で問題が発生した場合は他の機器の切断が有効かもしれません。
加速度の描画
今回のサンプルでは加速度をmatplotlibを用いリアルタイムに描画します。
上のサンプルで取得したinput_reportから加速度データを取得し、グラフ描画します。
joycon.get_status()の戻り値の形式はjoycon-pythonのREADME.mdを参照します。
import time
import numpy as np
from pyjoycon import device
from pyjoycon.joycon import JoyCon
from matplotlib import pyplot as plt

# ---- #
# init #
# ---- #
# JoyCon
ids = device.get_ids("L")
joycon = JoyCon(*ids)

# set figure
x_lim = 50
width = 2.5
t = np.zeros(100)
y = np.zeros(100)
plt.ion()
plt.figure()
li = plt.plot(t, y)
plt.ylim(0, 5)
xlim = [0, x_lim]
ylim = [-10000, 10000]
X, Y, Z, T = [], [], [], []

# ---- #
# plot #
# ---- #
while True:
    # get data
    input_report = joycon.get_status()
    print(input_report)
    # plot
    plt.cla()
    X.append(input_report["accel"]["x"])
    Y.append(input_report["accel"]["y"])
    Z.append(input_report["accel"]["z"])
    T.append(len(T))
    if len(X) > x_lim:
        xlim[0] += 1
        xlim[1] += 1
    plt.plot(T, X, linewidth=width, label="X-axis")
    plt.plot(T, Y, linewidth=width, label="Y-axis")
    plt.plot(T, Z, linewidth=width, label="Z-axis")
    plt.xlim(xlim[0], xlim[1])
    plt.ylim(ylim[0], ylim[1])
    plt.legend(bbox_to_anchor=(0, 1), loc='upper left',
               borderaxespad=0, fontsize=13)
    plt.pause(1/60)
このサンプルでは配列に加速度データを追加するのみで、削除はしていません。
長時間実行した場合、メモリが溢れる可能性があるため注意してください。