ServiceNow ITBMのアジャイル開発では、登録したストーリの進捗状況からBurnDownChartを表示することができます。
しかし、私達のチームがそれを使うにはいくつかの問題があったため、ServiceNowのREST APIから指定スプリントの情報を取得し、チャートを描画しSlack投稿するPythonプログラムを作成しました。
いくつかの問題
・土日祝休日も仕事をするような理想線になっている
・チャートを見るのにもたつく
・デイリーで関係者に共有したい(ロールの有無によらず)
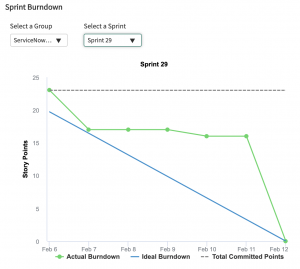
ServiceNowのBurnDownChartはこの様な感じです。
Feb 8,9,11は休日なのでポイントは消化されないべきですが、理想線(青色)が一直線に引かれています。
これでは進捗が遅れているのか一目で分かりにくいです。
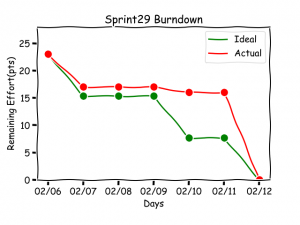
今回作成したプログラムで出力したBurnDownChartです。
土日祝日はポイントが消化されない様になっています、
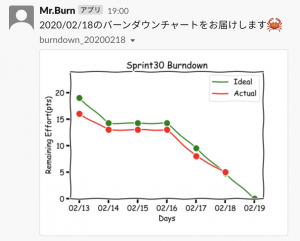
これが定期的(自動ではない)にSlackに投稿される仕組みです。
ソースコード
import pprint
import requests
import jpholiday
import datetime
import matplotlib.dates as mdates
import pandas as pd
import matplotlib.pyplot as plt
import urllib.request
import urllib.parse
import json
import datetime
from pytz import timezone
point_dict = {}

# --------- #
# 変数初期化 #
# --------- #
total_points = 0
done = 0
undone = 0
BASIC = 'Basic XXXXXXXXXXXXXXXXXXXXXXXXXXXXXXXXXXXXXXXXXXX='
SLACK_TOKEN = "xoxb-123456789012-123456789012-XXXXXXXXXXXXXXXXXXXXXXXX"
SLACK_CHANNEL = "XXXXXXXXX"
SPRINT = "XX"

# ----------- #
# Sprintを取得 #
# ----------- #
params = {
    'sysparm_query': 'short_description=Sprint ' + SPRINT
}
param = urllib.parse.urlencode(params)
url = "https://{your instance name}.service-now.com/api/now/table/rm_sprint?" + param
req = urllib.request.Request(url)
req.add_header("authorization", BASIC)
with urllib.request.urlopen(req) as res:
    r = res.read().decode("utf-8")
obj = json.loads(r)
# Sprintの開始日と終了日を取得
start_date = obj['result'][0]['start_date']
start_date = (datetime.datetime.strptime(start_date, '%Y-%m-%d %H:%M:%S') + datetime.timedelta(hours=9)).date()
print(start_date)
end_date = obj['result'][0]['end_date']
end_date = (datetime.datetime.strptime(end_date, '%Y-%m-%d %H:%M:%S') + datetime.timedelta(hours=9)).date()
# ポイント配列の初期化
while start_date <= end_date:
    point_dict[str(start_date)] = 0
    start_date = start_date + datetime.timedelta(days=1)

# ----------- #
# Storyを取得 #
# ----------- #
params = {
    'sysparm_query': 'sprint.short_descriptionLIKESprint ' + SPRINT
}
p = urllib.parse.urlencode(params)
url = "https://{your instance name}.service-now.com/api/now/table/rm_story?" + p
req = urllib.request.Request(url)
req.add_header("authorization", BASIC)
with urllib.request.urlopen(req) as res:
    r = res.read().decode("utf-8")
obj = json.loads(r)
# ストーリーでループ
for name in obj['result']:
    if len(name['story_points']) > 0:
        total_points += int(name['story_points'])
        if name['closed_at'] != '':
            close_date = datetime.datetime.strptime(
                name['closed_at'], '%Y-%m-%d %H:%M:%S')
            close_date = close_date.date()
            if name['state'] == '3':
                if str(close_date) in point_dict:
                    point_dict[str(close_date)] += int(name['story_points'])
                else:
                    point_dict[str(close_date)] = int(name['story_points'])
        if name['state'] == '3':
            done += int(name['story_points'])
        else:
            undone += int(name['story_points'])
counta = 0
for i in point_dict.items():
    counta += int(i[1])
    point_dict[i[0]] = total_points - counta
plt.xkcd()
fig, ax = plt.subplots()
# 実績線を作成する
x = []
y = []
plt.ylim(0, total_points + 5)
counta = 0
for key in point_dict.keys():
    if datetime.datetime.today() >= datetime.datetime.strptime(key, '%Y-%m-%d'):
        x.append(datetime.datetime.strptime(key, '%Y-%m-%d'))
        y.append(point_dict[key])
# 祝日判定
DATE = "yyyymmdd"
def isBizDay(DATE):
    Date = datetime.date(int(DATE[0:4]), int(DATE[4:6]), int(DATE[6:8]))
    if Date.weekday() >= 5 or jpholiday.is_holiday(Date):
        return 0
    else:
        return 1

# 平日の日数を取得
total_BizDay = 0
for key in point_dict.keys():
    if isBizDay(key.replace('-', '')) == 1:
        total_BizDay += 1
# 理想線を作成する
x2 = []
y2 = []
point_dict_len = len(point_dict)
average = total_points / (total_BizDay - 1)
for key in point_dict.keys():
    dtm = datetime.datetime.strptime(key, '%Y-%m-%d')
    x2.append(dtm)
    y2.append(total_points)
    # 翌日が平日なら理想線を消化する
    if isBizDay((dtm + datetime.timedelta(days=1)).strftime("%Y%m%d")) == 1:
        total_points -= average
days = mdates.DayLocator()
daysFmt = mdates.DateFormatter('%m/%d')
ax.xaxis.set_major_locator(days)
ax.xaxis.set_major_formatter(daysFmt)
plt.title("Sprint" + SPRINT + " Burndown")
plt.plot(x2, y2, label="Ideal", color='green')
plt.plot(x2, y2, marker='.', markersize=20, color='green')
plt.plot(x, y, label="Actual", color='red')
plt.plot(x, y, marker='.', markersize=20, color='red')
plt.grid()
plt.xlabel("Days")
plt.ylabel("Remaining Effort(pts)")
plt.subplots_adjust(bottom=0.2)
plt.legend()
# グラフの表示
# plt.show()
# グラフの保存
plt.savefig('figure.png')
# --------- #
# Slack通知 #
# --------- #
files = {'file': open("figure.png", 'rb')}
param = {
    'token': SLACK_TOKEN,
    'channels': SLACK_CHANNEL,
    'filename': "burndown_" + datetime.datetime.now().strftime('%Y%m%d'),
    'initial_comment': datetime.datetime.now().strftime('%Y/%m/%d') + "のバーンダウンチャートをお届けします:crab:",
    'title': "burndown_" + datetime.datetime.now().strftime('%Y%m%d')
}
res = requests.post(url="https://slack.com/api/files.upload",params = param, files = files)
print(res)
pprint.pprint(res.json())
今回はServiceNowのAPIからストーリー情報を取得しバーンダウンチャートを描画しました。
データの取得、集計、表示が簡単にできるので、さらに活用が期待できそうです。


